.jpg)
%20(1).webp)


The Engagement Platform was founded to support schools and trusts to track, monitor and improve employee engagement, in turn supporting higher staff retention, recruitment and improved staff wellbeing through identifying and acting on drivers of engagement.
Typical benchmarking within education research is based on historical data, perhaps collected from all time, or within the last 18 months. Within education, the pressures and landscape can change drastically over the course of 12 months. Strikes, funding changes, new policy initiatives and pandemics can shift perceptions and experiences significantly – resultingly live benchmarking should take these into account.
How is live benchmarking different to typical benchmarks?
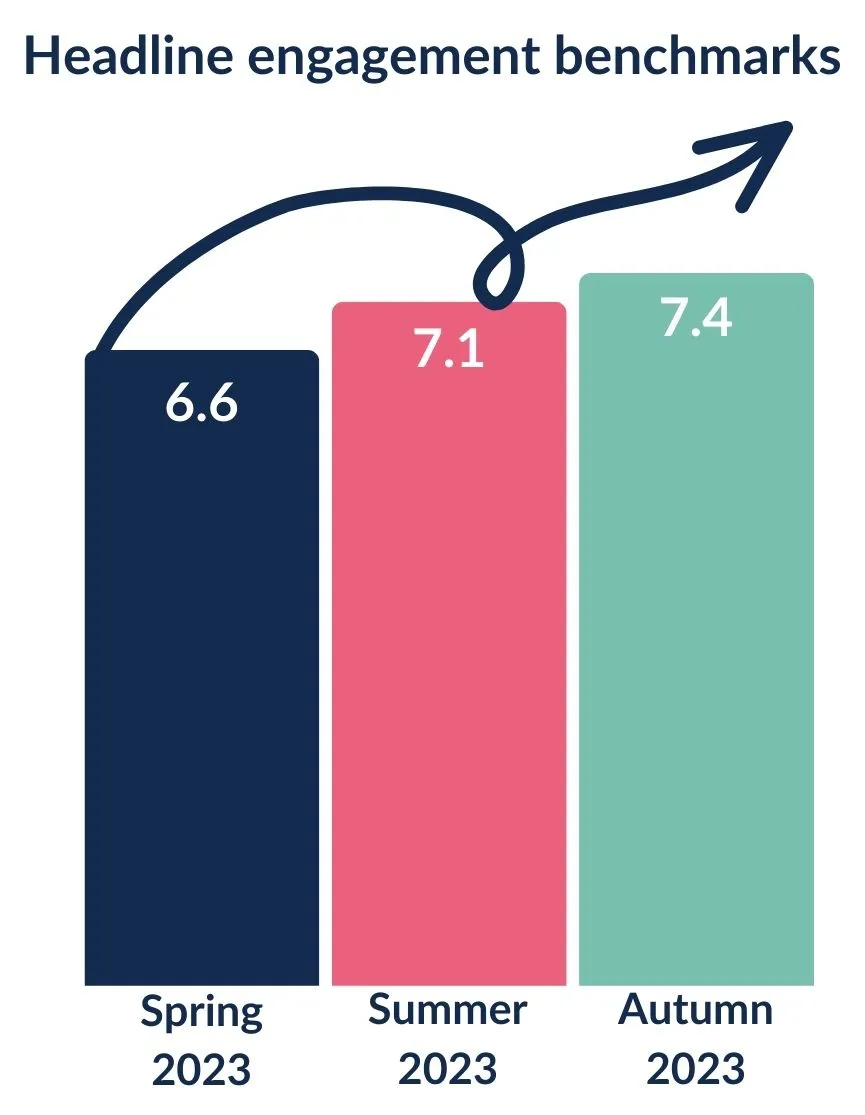
Without contextualisation, your data can be hard to interpret and won’t support strategic decision-making. At TEP, we provide live benchmarking which is designed to give leaders a robust comparison point, whilst still comparing like for like as much as possible. Live benchmarks are created for each of our six census windows and are available less than 24 hours after the census window closes. Our benchmarks are not based on historical data. Instead our benchmarks, provide you with a reliable comparison with other schools within the same time of year, with similar external effects and changing sentiment taking place in the education system (e.g. teachers strikes, policy announcements). Figure 1 reflects the change in sentiment nationally across the year.
We also provide national and contextual benchmarks.
National benchmarks
National benchmarks are determined by data from all school and trust types that took part in the census and are provided immediately after the collection window closes.
Contextual benchmarks
Contextual benchmarks are provided for any subgroup category (FSM numbers, school type, phase, size, LEA, Ofsted grade etc.) your school falls into, where there is 30+schools within that subgroup category. We require a minimum of 30 schools to give a meaningful contextual benchmark. We will be able to provide more of these as the TEP school community grows – for example regional benchmarks for every region and local authority nationally.
Role benchmarks
The experience of different staff roles can vary nationally, so it’s equally as important that we are comparing like for like. Role types are benchmarked against each other when you review role category data. For example, class teachers in your settings are compared to class teachers nationally, rather than your schoolwide benchmark. This is because we have standardised these role groupings so can give a direct comparison. The figure below shows how different roles have scored for workload in School X.
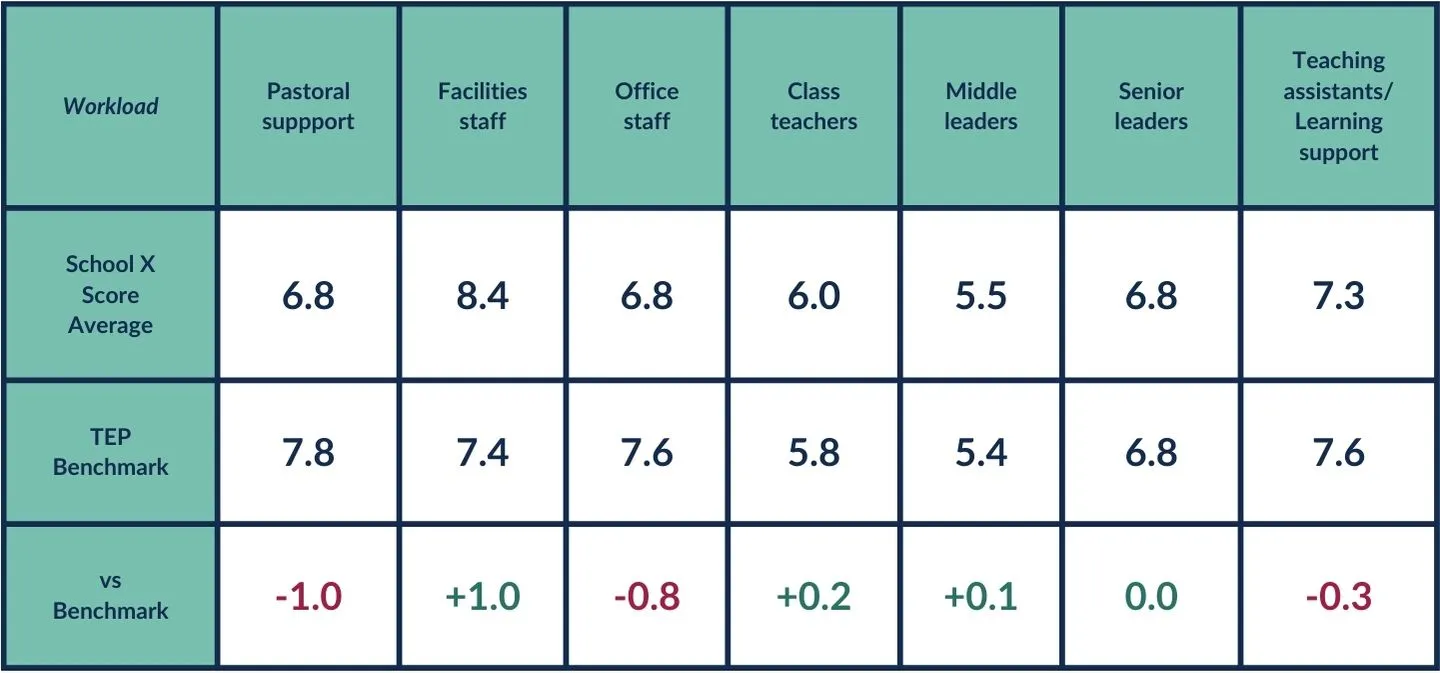
Classroom teachers in your setting would be comparatively benchmarked to all other classroom teachers, rather than being grouped alongside much higher scoring senior leaders. This national comparison means you can understand if you are creating a better than average experience for your team members.
Benchmarking in decision-making
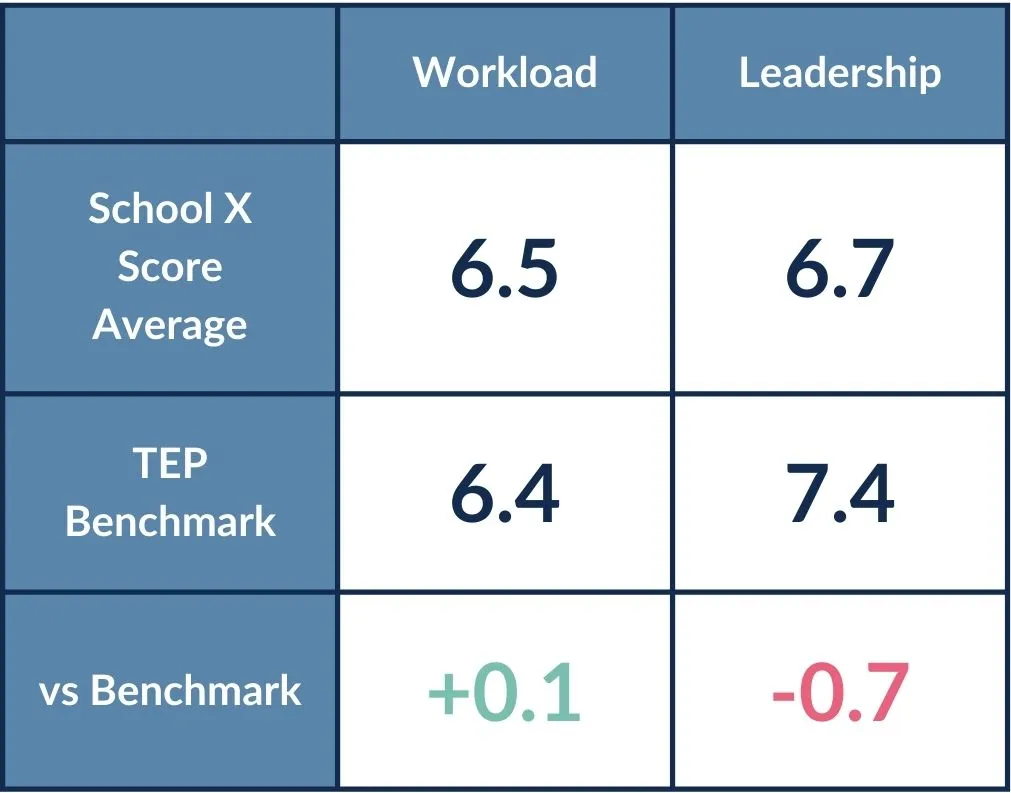
Our live benchmarking leads and supports you to deploy your resources in the areas where it will have the highest impact. In Figure 3, two driver scores from one of our anonymised schools is listed.
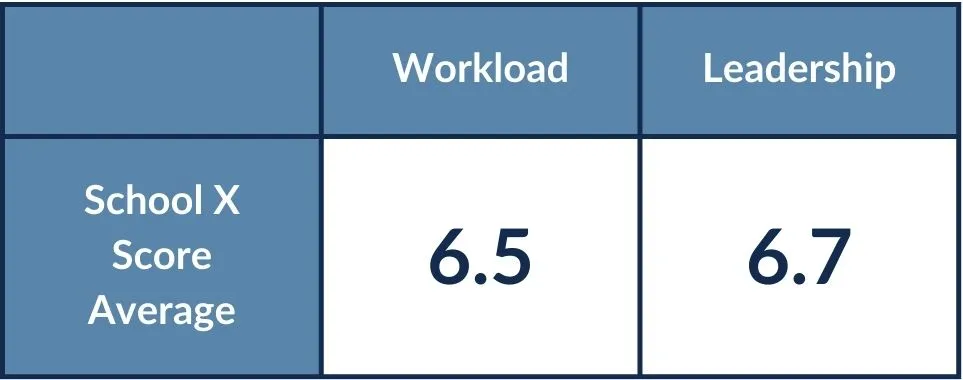
Looking again at School X, we can see their raw school average results for workload are lower than their leadership scores (scored out of 10). This is fairly typical, as staff answer workload questions in a notably different way to questions about leaders and people they know – thus rendering a direct comparison between these scores would be ineffective. To address this, TEP compares all scores to the TEP national census benchmarks – giving you a better understanding of how your school has fared. TEP shows you where your leaders can make the difference. Without these national consensus benchmarks, you may have put lots of time and energy into reducing workload, rather than spending time improving leadership areas, which could in turn have an impact on those lower workload scores.
Live APC benchmarking
Not only do we provide mean benchmarks - our unique APC scoring give you an understanding of how your team fit in the national distribution. As with the mean benchmarks - this is create live in each census window. This sorts your staff responses into the top, middle and lower third of national responses, allowing a quick understanding of the distribution of Advocates, Passives and Challengers in your organisation compared to the national benchmark.
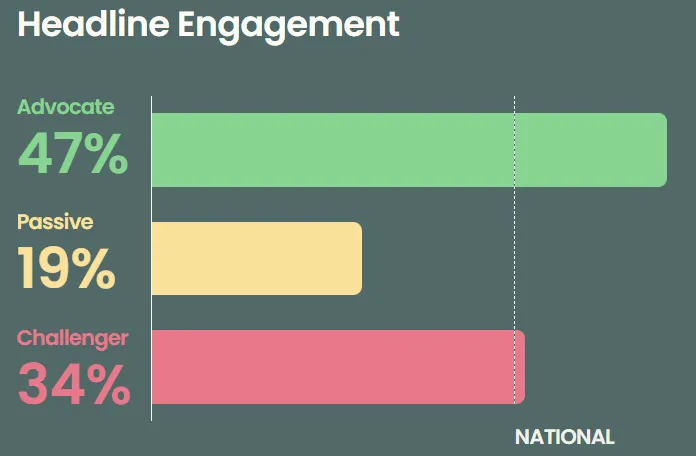
For a deeper dive into our APC scoring please have a read of our latest blog here!
Leading, not lag data
We conduct census windows throughout the year as we think it’s important for these metrics to form leadership discussions and track progress. We don’t wait for an end of year retrospective survey that will quickly be out of date.
The regularity of the census windows also allows rapid and frequent impact updates, for example, like tracking the effectiveness of a new behaviour management policy or a new marking policy on teacher workloads. These live benchmarks allow you to track your employee engagement against the live national sentiment of school staff.
Keen to know how you measure up against similar schools in your community?
Sign up today to be involved in our Summer Census, starting 17th June, contact hello@tep.uk .
Already work with us?
Refer a colleague! As our pool of partners increases, we’ll be able to offer even more contextual benchmarks.

.png)